Comparaison de langages de programmation (4) : Génération d'images
Date: 2025-05-14
Tags: C python soft benchmark pi
Articles
Cet article fait partie d’une série de plusieurs articles comparant les langages de programmation :
- Comparaison de langages de programmation : Méthode Monte-Carlo
- Comparaison de langages de programmation (2) : Optimisations en langage C
- Comparaison de langages de programmation (3) : Méthode Monte-Carlo avec d’autres langages
- Comparaison de langages de programmation (4) : Génération d’images
- Comparaison de langages de programmation (5) : Surface d’un disque
Approximation de Pi par la méthode Monte-Carlo, avec génération d’images
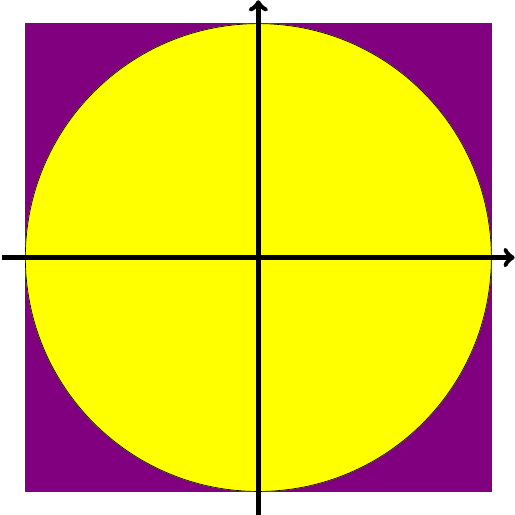
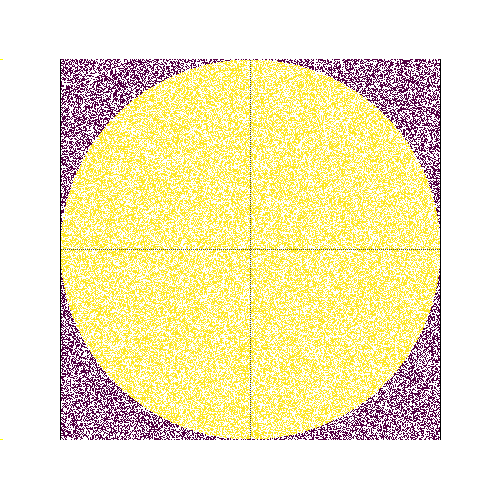
C’est une extention du premier article, où on utilise toujours la méthode Monte-Carlo1, à la différence que l’on génère des tableaux de taille définie et au contenu aléatoire, dont on va écrire le contenu dans un fichier. Dans ce cas, on utilisera un disque complet, inscrit dans un carré, centrés au milieu de l’image.

Le résultat doit approcher , être affiché dans la console, et le contenu du tableau doit-être écrit dans un fichier PNG ou BMP.
Note : Aucun résultat précis de Pi n’est attendu en considérant les approximations utilisées. Le type de variables (double et float64), et la taille finie de la matrice sont limitantes.
Approximation de Pi en C
Pour simplifier, on dessine des parties de l’image avant et après le remplissage de la matrice.
#define SIZE_PX 500
#define OFFSET 60

unsigned char image[SIZE_PX][SIZE_PX][3] = {{{255}}};
// white background
for(i = 0; i < SIZE_PX; i++) {
    for(j = 0; j < SIZE_PX; j++) {
        image[i][j][0] = 0xff;
        image[i][j][1] = 0xff;
        image[i][j][2] = 0xff;
    }
}
for(k = 0; k < n; k++) {
    for(i=OFFSET; i<=(SIZE_PX-OFFSET); i++) {
        for(j=OFFSET; j<=(SIZE_PX-OFFSET); j++) {
            // loops across X and Y
            if(rand() > (RAND_MAX>>1)) {
                // avg value = 0.5
                if(((i-(SIZE_PX>>1))*(i-(SIZE_PX>>1)) + \
                    (j-(SIZE_PX>>1))*(j-(SIZE_PX>>1))) < \
                    ((SIZE_PX>>1)-OFFSET)*((SIZE_PX>>1)-OFFSET) ) {
                // if X*X+Y*Y < 1
                    // Yellow
                    image[i][j][2] = 0xfd;
                    image[i][j][1] = 0xe7;
                    image[i][j][0] = 0x25;
                    count++;
                }
                else {
                    // Purple
                    image[i][j][0] = 0x44;
                    image[i][j][1] = 0x01;
                    image[i][j][2] = 0x54;
                }
            }
        }
    }
}
for(i = OFFSET; i <= (SIZE_PX-OFFSET); i++) {
    for(j = 0; j <= 2; j++) { // loop for RGB
        // black square box around plot
        image[i][OFFSET][j] = 0;
        image[i][SIZE_PX-OFFSET][j] = 0;
        image[OFFSET][j][0] = 0;
        image[SIZE_PX-OFFSET][j][0] = 0;

        // axis, grey, dashed
        if(i%2) {
            image[i][SIZE_PX>>1][j] = 0x40;
            image[SIZE_PX>>1][i][j] = 0x40;
        }
    }
}
Il faut mettre les mains dans le cambouis pour générer un fichier au format Bitmap2. C’est long, mais tout à fait réalisable :
unsigned char header[54] = {0};
unsigned char padding[3] = {0};
unsigned int i;
int width_padding = SIZE_PX*3 + (4 - (SIZE_PX*3 % 4)) % 4;
unsigned char *img = &image[0][0][0];

header[0] = 'B';
header[1] = 'M';
header[2] = (unsigned char) (sizeof(header) + width_padding*SIZE_PX);
header[3] = (unsigned char) (sizeof(header) + width_padding*SIZE_PX) >> 8;
header[4] = (unsigned char) (sizeof(header) + width_padding*SIZE_PX) >> 16;
header[5] = (unsigned char) (sizeof(header) + width_padding*SIZE_PX) >> 24;
header[10] = sizeof(header);
header[14] = 40;
header[18] = (unsigned char) (SIZE_PX);
header[19] = (unsigned char) (SIZE_PX >> 8);
header[20] = (unsigned char) (SIZE_PX >> 16);
header[21] = (unsigned char) (SIZE_PX >> 24);
header[22] = (unsigned char) (SIZE_PX);
header[23] = (unsigned char) (SIZE_PX >> 8);
header[24] = (unsigned char) (SIZE_PX >> 16);
header[25] = (unsigned char) (SIZE_PX >> 24);
header[26] = 1;
header[28] = 24;

FILE *imageFile = fopen(filename, "wb");
fwrite(header, 1, 54, imageFile);
for(i = 0; i < SIZE_PX; i++) {
    fwrite(img + i*3*SIZE_PX, 3, SIZE_PX, imageFile);
    fwrite(padding, 1, (4 - (SIZE_PX*3 % 4)) % 4, imageFile);
}
fclose(imageFile);
Approximation de Pi en Python
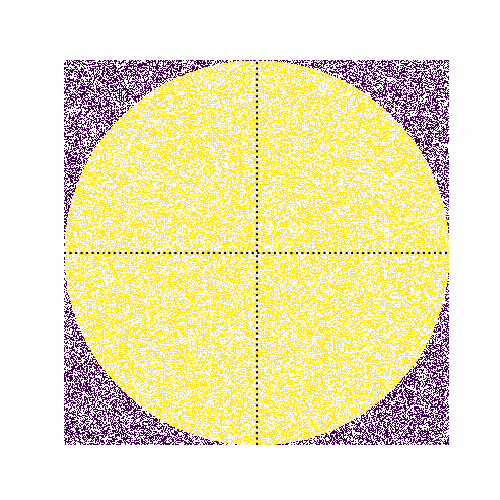
Ici, l’utilisation de bibliothèques est recommandée, Numpy3 permet de manipuler des vecteurs et matrices, et Matplotlib permet d’afficher des matrices de points.
J’ai passé longtemps à trouver une solution efficace pour tester si chaque point de la matrice appartient au cercle :
- np.linalg.norm : je n’ai pas vraiment compris comment l’utiliser et mes tentatives utilisaient une quantité de mémoire déraisonnable (>500MB)
- Deux boucles imbriquées à chaque itération : l’utilisation de ressources mémoire est acceptable, mais l’opération est 70 fois plus lente qu’en C
- Génération d’une matrice constante contenant +1 à l’intérieur du cercle et -1 en dehors, puis utilisation de Numpy pour multiplier cette matrice avec celle qui a été générée aléatoirement. L’opération est beaucoup plus rapide et utilise une quantité de mémoire acceptable
La génération de plusieurs matrices utilisait ce code :
SIZE_PX = 500
OFFSET = 60
w = SIZE_PX-2*OFFSET

count = 0
bitmap = np.zeros([w, w])
for k in range(0, n):
    rand = rng.random([w, w]) < 0.5
    for i in range(0, w):
        for j in range(0, w):
            if(rand[i][j] == True):
                if((i-w/2)*(i-w/2)+(j-w/2)*(j-w/2) < w*w/4):
                    count += 1
                    bitmap[i][j] = 1
                else:
                    bitmap[i][j] = -1
On le remplace par cette solution :
SIZE_PX = 500
OFFSET = 60
w = SIZE_PX-2*OFFSET

count = 0
bitmap = np.zeros([w, w])
circle = np.zeros([w, w])

# This nested loop is still slow, but only needs running once
for i in range(0, w):
    for j in range(0, w):
        if((i-w/2)*(i-w/2)+(j-w/2)*(j-w/2) < w*w/4):
            circle[i][j] = 1
        else:
            circle[i][j] = -1

# Numpy allows matrix operation without loops
for i in range(0, n):
    rand = rng.random([w, w]) < 0.5
    bitmap += circle*rand
    count += np.where(bitmap > 0, 1, 0).sum()
L’affichage utilise ce code avec la bibliothèque Matplotlib4 :
fig, ax = plt.subplots(figsize=(w, w))
colormap = colors.ListedColormap(['#440154', '#FFFFFF', '#fde725'])
ax.matshow(circle, cmap=colormap)
ax.set_axis_off()
ax.axhline(y=w/2, color="black", linestyle=":")
ax.axvline(x=w/2, color="black", linestyle=":")
plt.savefig('pyvis.png')
#plt.show()
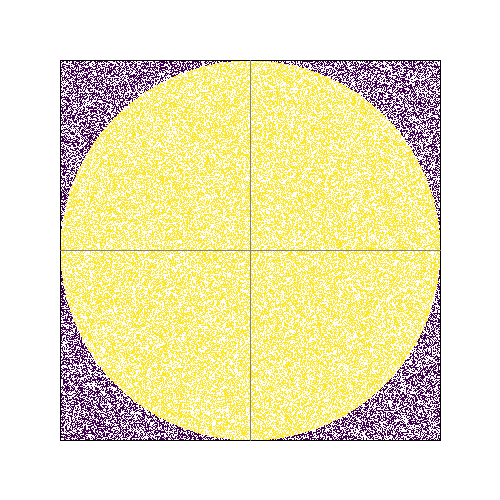
On peut remarquer que Matplotlib est lent et prend environ 1.2 s pour générer une image de 500*500px, principalement parce qu’elle est faite pour représenter un à deux vecteurs et pas des matrices 2D. On va plutôt essayer la bibliothèque Pillow5 qui sert à manipuler des images point par point :
# RGB palette
bitmapr = np.where(bitmap == 0, 0xff, 0)    # White background
bitmapg = np.where(bitmap == 0, 0xff, 0)
bitmapb = np.where(bitmap == 0, 0xff, 0)

bitmapr += np.where(bitmap < 0, 0x44, 0)    # Purple square
bitmapg += np.where(bitmap < 0, 0x01, 0)
bitmapb += np.where(bitmap < 0, 0x54, 0)

bitmapr += np.where(bitmap > 0, 0xfd, 0)    # Yellow circle
bitmapg += np.where(bitmap > 0, 0xe7, 0)
bitmapb += np.where(bitmap > 0, 0x25, 0)

bitmap2 = np.dstack((bitmapr, bitmapg, bitmapb))

im = Image.new("RGB", (SIZE_PX, SIZE_PX), (0xff, 0xff, 0xff))   # White background
im.paste(Image.fromarray(bitmap2.astype('uint8')).convert("RGB"), \
    (OFFSET, OFFSET, SIZE_PX-OFFSET, SIZE_PX-OFFSET))   # bitmap centered between margins

draw = ImageDraw.Draw(im)   # borders and axis
draw.rectangle( (OFFSET, OFFSET, SIZE_PX-OFFSET, SIZE_PX-OFFSET), outline=(0, 0, 0) )
draw.line( (SIZE_PX/2, OFFSET, SIZE_PX/2, SIZE_PX-OFFSET), fill=(128, 128, 128) )
draw.line( (OFFSET, SIZE_PX/2, SIZE_PX-OFFSET, SIZE_PX/2), fill=(128, 128, 128) )

im.save('pyvis.bmp')
#im.show()
Le code est plus complexe et m’a pris 30 minutes de plus, en comptant la lecture de la documentation de Pillow67, par contre, l’exécution ne prend plus que 40 ms au lieu de 1.2 s.
Résultats
| Langage | C | Python | |
|---|---|---|---|
| Durée d’écriture de code [min] | 120 | 120 | |
| Durée de compilation [s] | 0.1 | 0 | |
| Durée d’exécution [s] | 3.03 | 3.15 | |
| Nombre de lignes | 100 | 52 | |
| Profondeur de boucles | 3 | 3 |
Dans ce cas arbitraire, l’utilisation de bibliothèques écrites en C++ et optimisées permet au langage Python d’être relativement performant. Le fait qu’il soit nécessaire de réfléchir pour écrire du code efficace et performant le rend similaire au C.
Mon premier essai en Python non-optimisé avait pris environ 45 minutes à écrire, mais s’exécutait beaucoup plus lentement qu’avant son optimisation.
Il n’y a aucune surprise, un code à l’exécution rapide et efficace peut prendre du temps à écrire. Le langage C impose cette technique, alors que Python est plus permissif, ce qui le rend pratique pour prototyper.
Le nombre de lignes réduit fait aussi partie de la réputation de Python en tant que langage productif, où il suffit d’écrire peu d’instructions pour réaliser des actions complexes.
Le code source est disponible8 sous license CC BY-NC.
Références
- ← Previous page
Comparaison de langages de programmation (3) : Autres langages - Next page →
Comparaison de langages de programmation (5) : Surface d'un disque
Electronics Électronique puissance semiconducteur semiconductors power Hardware CPE INSA Xavier Bourgeois
 RSS - Blog